Our Jisc Learning analytics –Data and disadvantaged student’s webinar in February was well attended. If you missed it, don’t worry, you can still view the recording and download the slides.
As anticipated, the audience was diverse. Staff from disability support services, teachers and data managers were attracted by the deliberately broad-ranging title. Our aim was to demonstrate that to transform the student experience, staff from very different disciplines will need to collaborate and share their expertise in order to gather the right data and use it well.
As Niall Sclater from the Jisc Learning Analytics Project attests in his blog posts, learning data needs careful interpretation. Learning analytics is Not FACT but prediction and comparison – however, you are not always comparing like with like. Having identified 86 possible ethical implications of using data from disadvantaged students Niall developed the Jisc Code Of Practice for learning analytics. This provides the context for the cross-organisational discussions on what data should be gathered and how to interpret it.
Most people who attended were optimistic that data could be used to shape better support and teaching by directly measuring their impact on learning gains. There were also worries about inappropriate data sources, inaccuracies and incorrect interpretation of personal data. Our purpose in bringing everyone together was to balance the concerns and expectations with practical skills and knowledge. Delegates were invited to share their ideas and fears and ‘vote’ on their priorities in our delegates survey.
With such a purposefully diverse audience there were inevitably those whose current involvement with data is marginal, some using data for limited purposes, with no need to know where it comes from or where it goes. Whilst others had comprehensive knowledge of data systems but perhaps very little direct experience of the issues that disabled students face and therefore less real knowledge of how to interpret it.
Whether you are designing the data, using it to support learner progress or to evaluate institutional services or delivery, cooperation is key. The following comments highlight the potential value of meaningful data for a range of staff roles.
Examinations Officers, Dyslexia Specialists and Study Support Staff.
Streamlining data on access requirements, attendance and progression:
“It’s always involved lots of consultation and meetings. Now it’s just a touch of a button”
“Student data helps me track the progress …and respond more swiftly.”
Head of Disability Support, Assistive and Learning Technologists, Study Skills Tutors.
Evaluating the efficacy of productivity tools and assistive technology assessments:
“We’ve capture specific detail about technology strategies.”
“Now there’s is less room for students to slip through the net because all support services have the same information so we can work together.”
Digital Collection Managers and Library Staff.
Monitoring the use of e-books, digital resources and library platforms:
“I can see who is using the learning platform and how often. This makes it easy to see where content might be difficult to access.”
Lecturers, E-learning managers and Heads of Quality.
“I can see how changes to resources and activities have impacted on engagement and benefited disabled students.
“I can begin to correlate outcomes for disabled student with online provision in different subject areas. Now I have proof that CPD in blended learning pays dividends for disabled students.”
Whatever your role, what is clear is that a collaborative approach between data, learning and support experts will be required to ensure effective use of all the data available. Staff in different roles may only be involved in specific ‘stages’ of data use. The key will be joining them up.
What can you do?
Like the delegates at the webinar it may be useful to begin by reflecting on:
Whether the data collected in your organisation accurately reflects all your learners needs? If not how could this be improved? More importantly, who would need to be involved? Find out if there are data sets related to disability that would add insight that are not routinely used in this context. For example: Information on the use of e-resources might reveal additional barriers for print impaired learners if it included all dyslexic learners – even those who no longer receive Disabled Students Allowance? Could you access more detailed data. Could more learners be encouraged to self-disclose?
Does the data actually tell you what you want to know? Measuring attendance, doesn’t measure engagement and it may present an inaccurate picture of learners who have more difficulty attending a lecture because of a disability. How should you use this data to inform the debate about the value of lecture capture and its impact on attendance? Are you able to measure who watches recorded lectures and why they prefer them?
How well does learning analytics data currently support consistency and clarity? It follows that where you have different definitions of ‘disability data’ you will end up telling different stories and making different adjustments.
How will you know what data sources are available and which are being used? The University of Wolverhampton identified more than 3o different possible sources of support for students, but not all will contribute to the learner profiles.
What works?
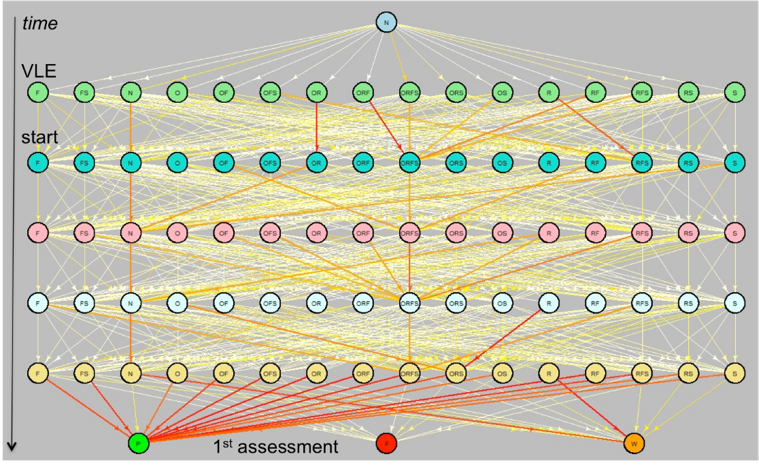
To reassure and inspire us Dr Anika Wolff described an Open University research project that explored how learning analytics could be used to identify modules with accessibility deficits. Acknowledging that the low numbers of disabled students would skew the results the OU used odds ratios to establish where accessibility may be a problem but not where the problem lies or how to address it. More detailed monitoring of the critical paths in VLE use by successful learners could help indicate access issues when compared to paths used by disabled learners. As in Paul Baileys’s reflection on Jisc’s recent Digifest debate on whether Learning analytics interventions should always be mediated by a human being, the key is designing data that recognises context and is based on varied specialist knowledge.
We began the webinar by reflecting on how we constantly refine our ‘communications’ to suit our audience by using an increasingly fine ‘net of meanings’ in the language we use. Extracting the real ‘meaning’ from Learning Analytics data requires similar insight and careful interpretation, based on shared skills and knowledge. Then there will be real potential to clarify how institutions processes, content and teaching activities contribute to an improved student experience, for everyone.
If you have any thoughts or ideas on adding meaning to learning analytics please feel free to share them here. Keep up with developments via the Jisc Effective learning analytics blog and join the discussion on #learninganalytics. If your institution is interested in our learning analytics service, email setup.analytics@jisc.ac.uk.